Candlestick Patterns: A Classic Approach to Trading
Candlestick patterns are essential tools used by traders to analyze market conditions based on candlestick charts. These patterns consist of one or more candles forming specific shapes on the chart. By examining these patterns, traders can evaluate past price behaviors and recognize recurring figures.
Each candle provides insights into price changes and market direction based on its color, shape, and shadows. Iconic candle types such as doji, spinning top, harami, hammer, or hanged man each convey unique information about market dynamics. When grouped together, candles form patterns that facilitate deeper analysis of price movements, aiding in the interpretation of market sentiment and the potential for trend reversals or continuations.
Candlestick patterns encompass bearish, bullish, and neutral formations. While effective in identifying patterns in asset prices, it’s important to note that they do not predict future price movements. Instead, they serve as historical indicators that assist traders in making informed decisions during technical analysis.
Understanding Candlestick Patterns
Candlestick charts originated in 18th century Japan, featuring patterns and shapes with Japanese names. These charts gained global popularity in the late 1990s and have since become indispensable for traders worldwide.
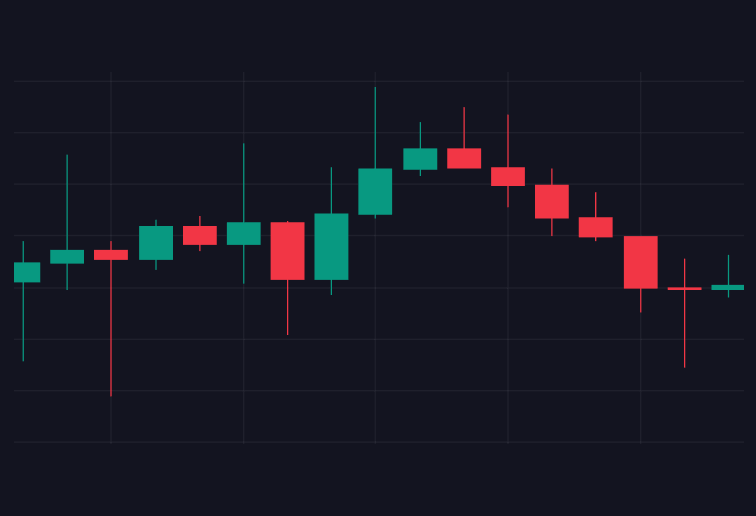
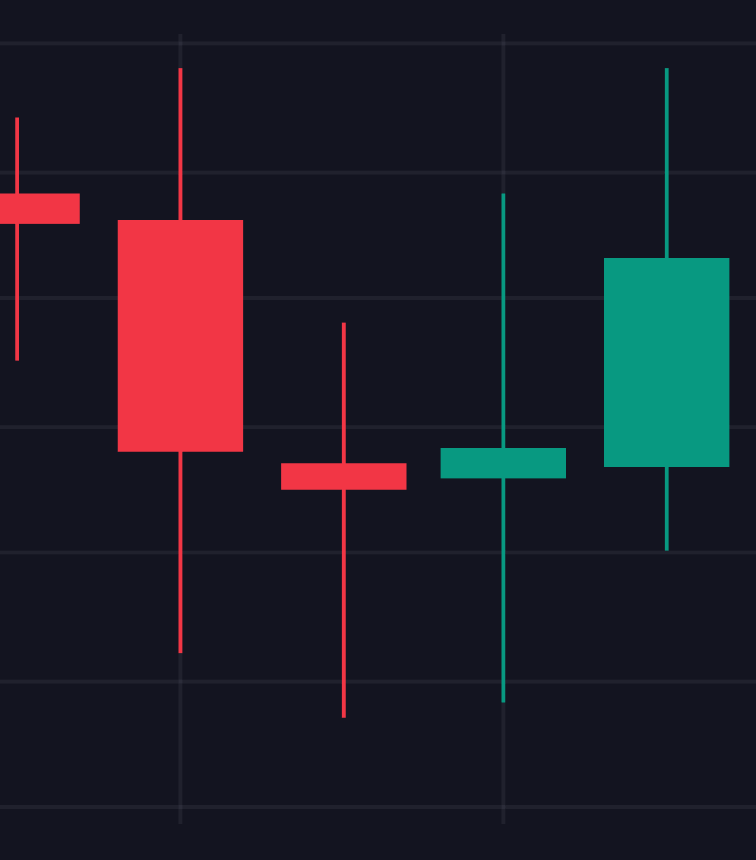
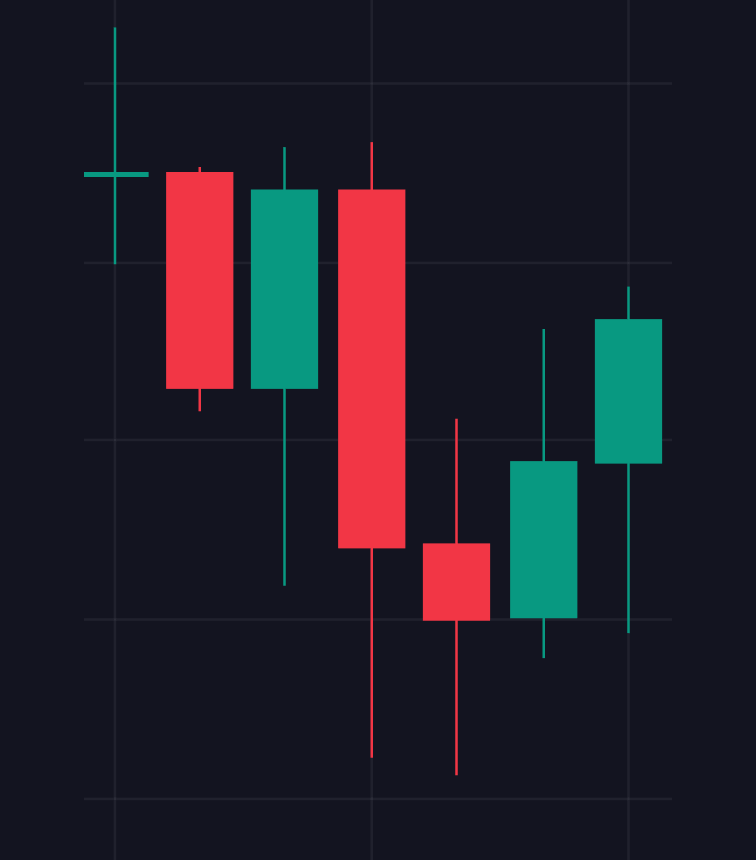
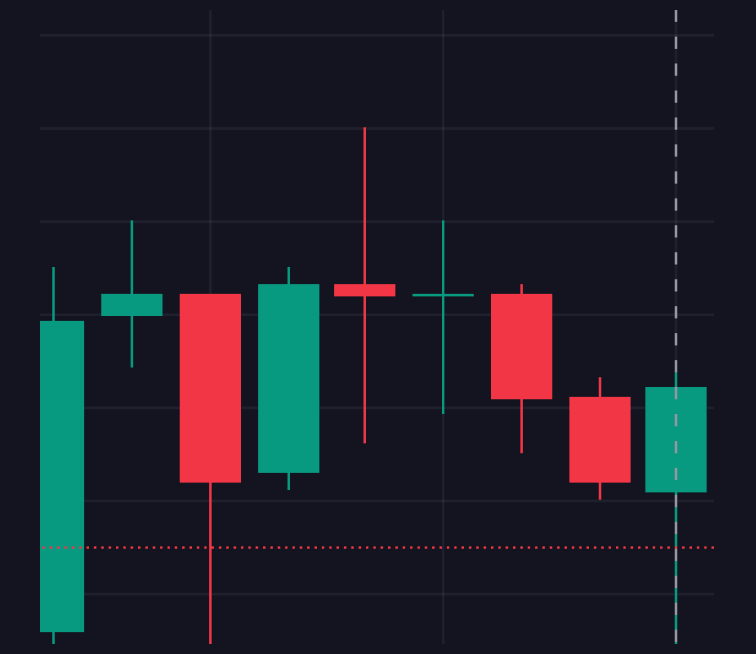
Each candle on a candlestick chart represents a specific time period, such as daily, weekly, or minute intervals, depending on the chosen settings. The candle’s main body, often green (or blue) for upward movements and red for downward movements, illustrates the price range between the opening and closing prices within that period. In a green candle, the lower body indicates the opening price and the upper body shows the closing price. Conversely, in a red candle, the upper body displays the opening price and the lower body represents the closing price. Candle wicks (shadows) extend from the top and bottom, indicating the highest and lowest prices reached during that time frame.
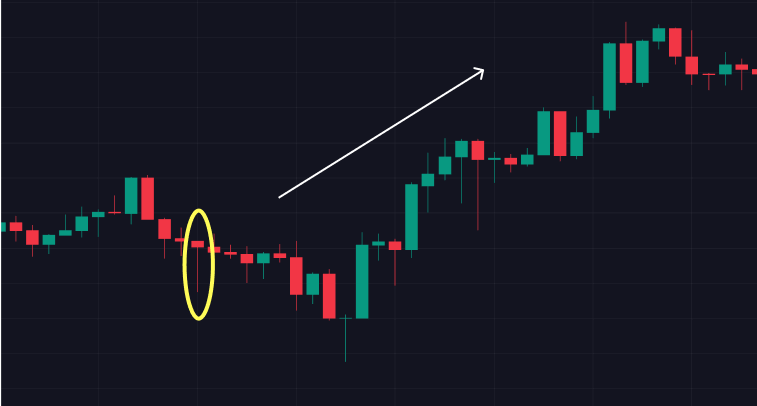
Thus, each candlestick encapsulates valuable data for traders to analyze future market movements. For instance, a long lower wick suggests a sharp price decline followed by recovery, indicating robust buying interest and potentially signaling a broader reversal trend.
However, while candlestick patterns provide insights into past market behavior, they do not guarantee accurate predictions of future price movements. Traders should conduct thorough research, acknowledge the inherent risks of trading, and avoid investing funds they cannot afford to lose. Candlestick patterns should be utilized as one of several analytical tools to enhance informed trading decisions.
Types of Candlestick Patterns
Candlestick patterns are categorized into three main types: bullish, bearish, and uncertainty patterns.
Bullish candlestick patterns
Bullish candlestick patterns appear during upward market trends, signaling bullish momentum. These patterns indicate that buyers dominate the market, suggesting that prices are likely to continue rising. Examples include the hammer, bullish engulfing, and harami patterns.
Bearish candlestick patterns
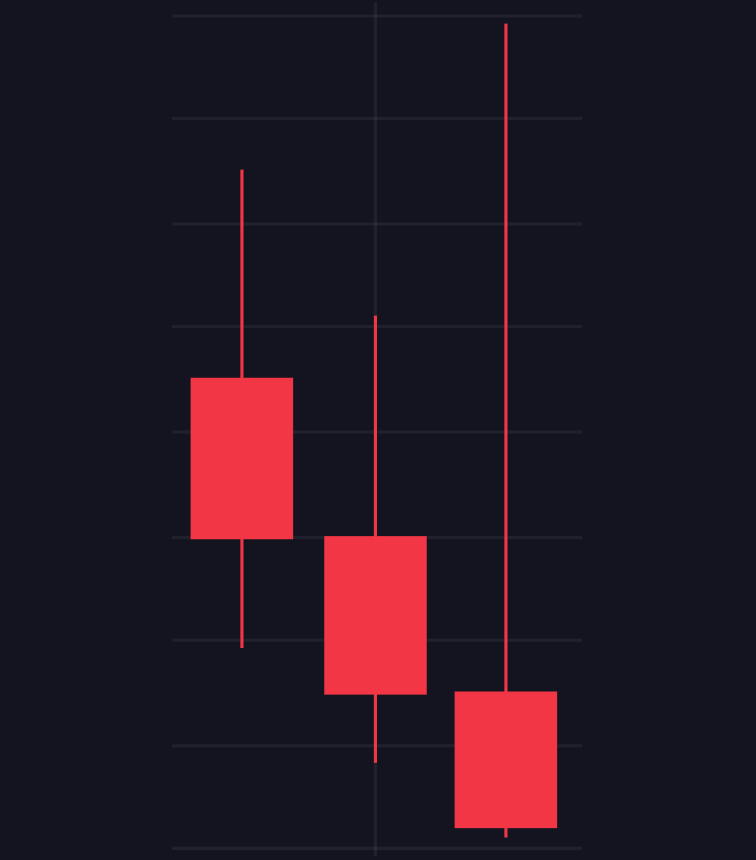
Bearish candlestick patterns emerge in declining markets, indicating bearish momentum. These patterns signify that sellers control the market, implying that prices are likely to continue falling. Examples include the hanging man, bearish engulfing, and bearish harami patterns.
Uncertainty patterns
Uncertainty patterns typically exhibit small real bodies and long shadows, reflecting market indecision. These patterns suggest neither buyers nor sellers have a clear advantage, leaving prices susceptible to movement in either direction. Examples include doji and spinning top patterns.


How to Identify Candlestick Patterns on Charts
Traders utilize candlestick charts in their technical analysis to forecast future market movements and devise trading strategies. Identifying candlestick patterns involves several crucial steps:
1. Analysis of Individual Candles.
Traders meticulously examine the shape and color of each candle to interpret market dynamics.
2. Recognition of Patterns.
After analyzing individual candles, traders identify whether they form recognized patterns, such as bullish, bearish, or uncertainty patterns.
3. Strategy Application.
Based on identified patterns, traders formulate strategies. For instance, spotting a bullish pattern might prompt a trader to consider opening a long position, while a bearish pattern might suggest going short.
Effectively using candlestick patterns requires practice and an understanding of market conditions. Traders should integrate candlestick patterns with other analytical tools and methodologies to enhance the accuracy of their predictions and trading decisions.
Explanation of Candles and Candlestick Patterns
To interpret candlestick patterns effectively, familiarity with common patterns is essential. Below are some frequently encountered patterns used by traders:
1. Doji
Doji — a candle where the opening and closing prices are nearly identical, indicating significant market movement followed by a return to the starting level.
There are three main types:
Dojis suggest uncertainty where prices may be volatile but tend to revert to the mean, occasionally signaling impending price changes.
2. Spinning Top


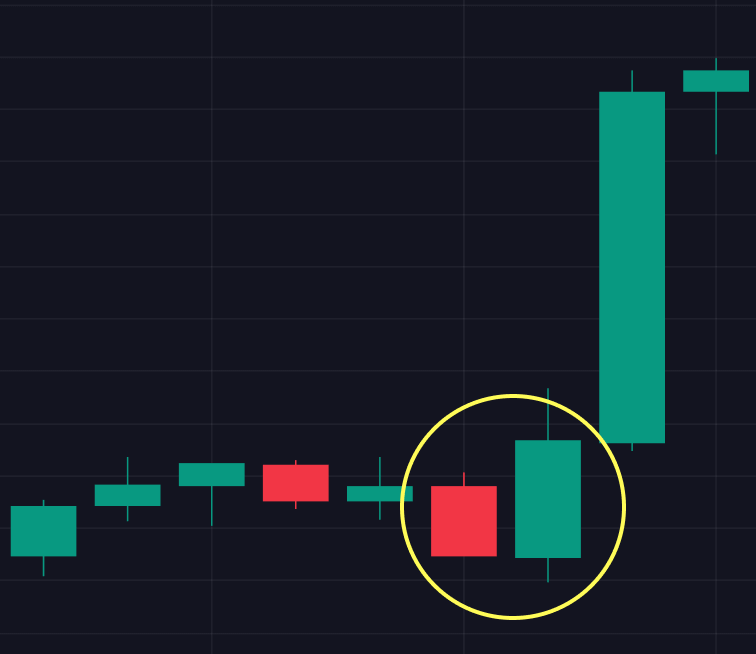
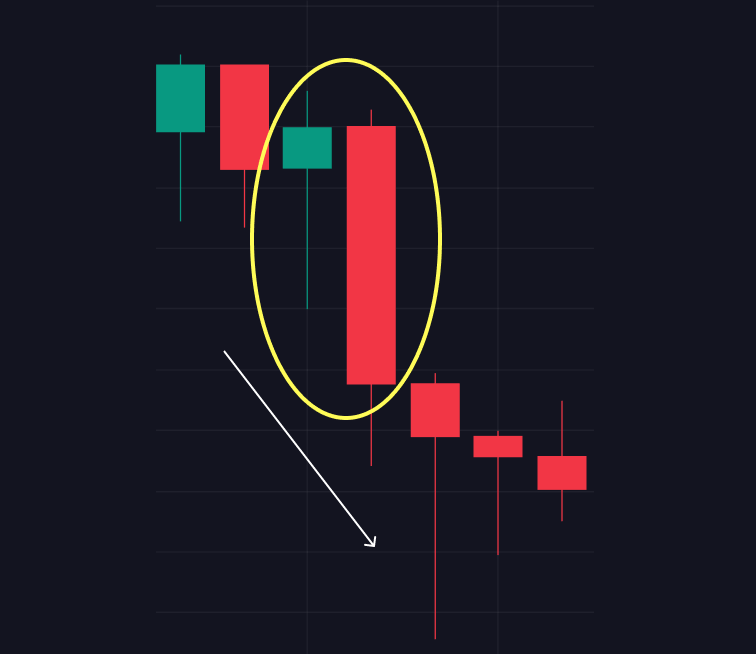
3. Absorption Patterns
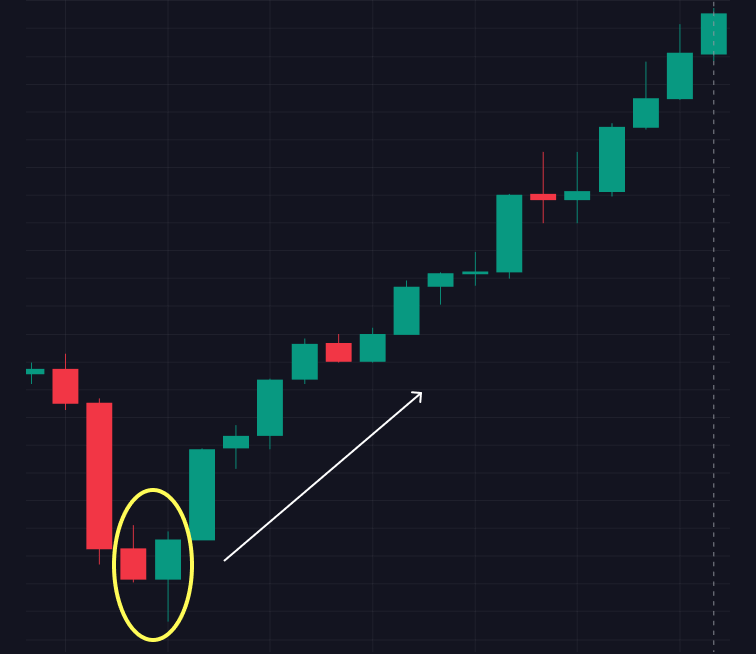
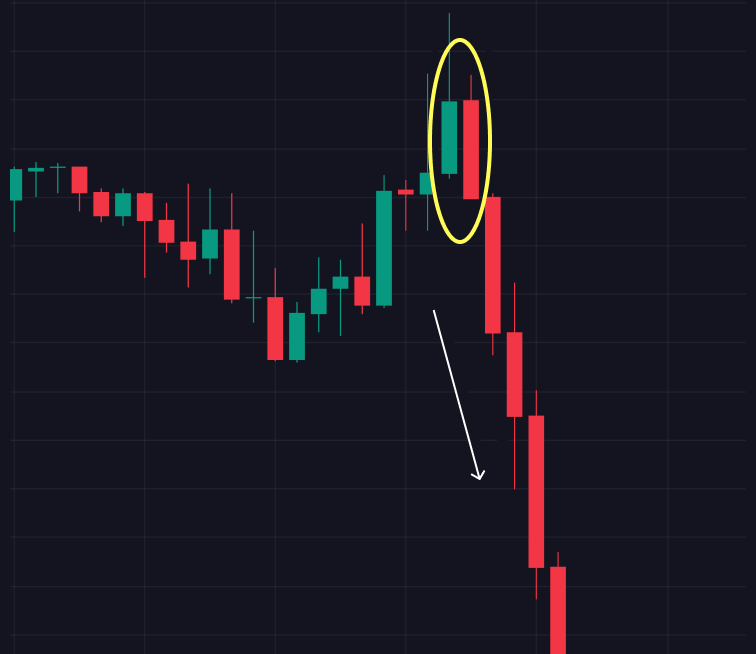
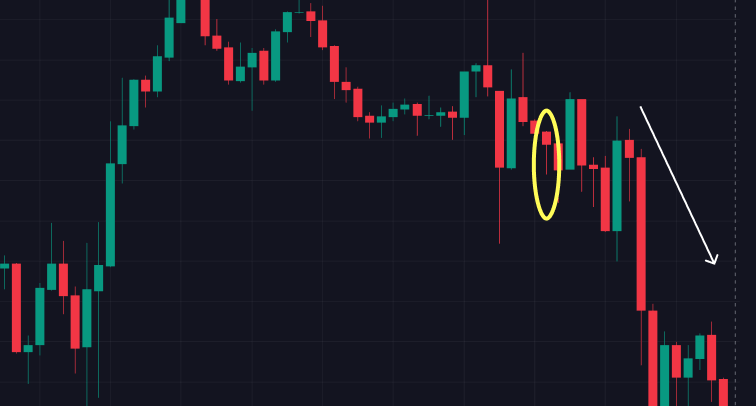
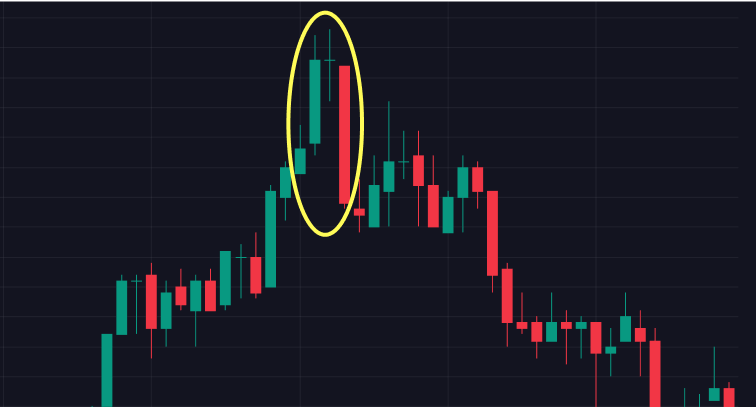
Engulfing patterns are candlestick formations that signal potential trend reversals, either bullish or bearish:
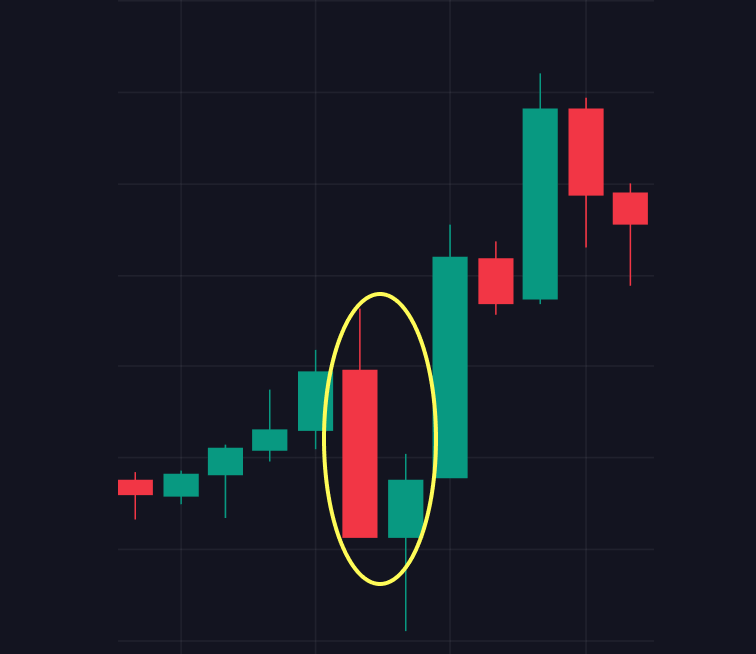
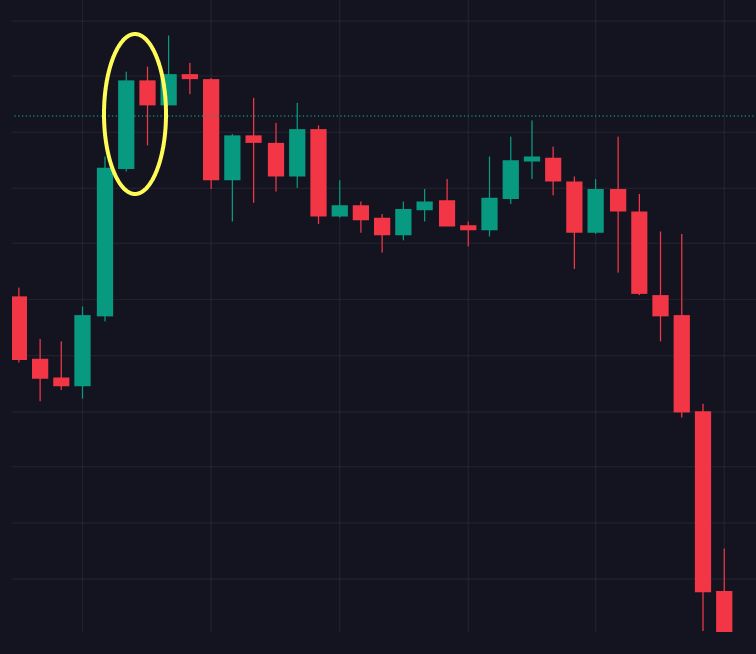
Harami is another type of candlestick pattern that can be bullish or bearish:
Other notable candlestick patterns include:
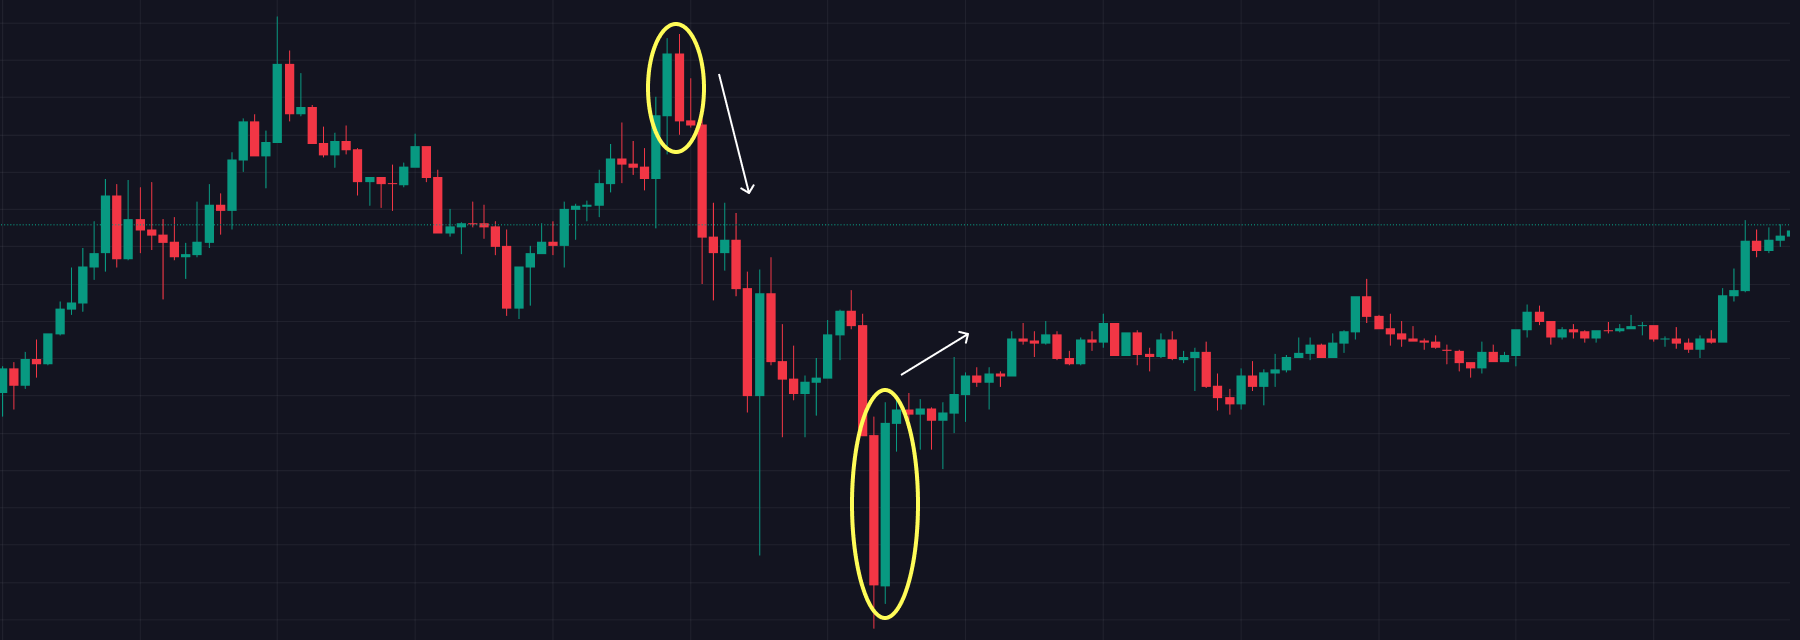
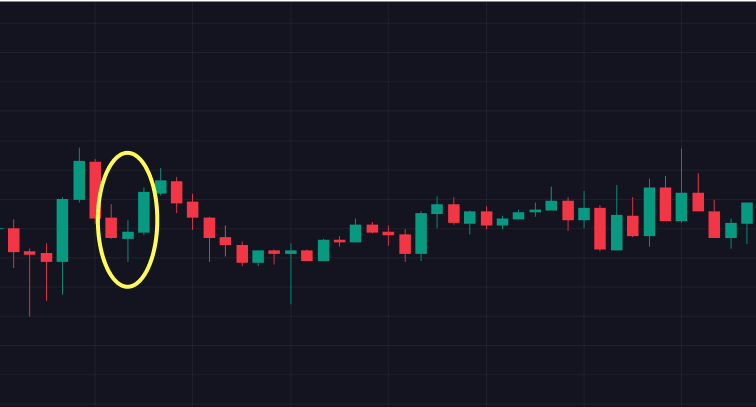
Abandoned Baby (Island Reversal).
This pattern comes in bullish and bearish forms:
These patterns are valuable for identifying potential changes in market trends and for making trading decisions within short timeframes. Traders can adapt their strategies based on the current market conditions and the specific patterns observed.
Conclusions
Understanding individual candlesticks involves recognizing that for green (or blue) candlesticks, the bottom and top parts of the body represent the opening and closing prices within the period. Conversely, for red candlesticks, the upper body signifies the opening price, and the lower body denotes the closing price. The wicks or shadows at both ends illustrate the highest and lowest prices reached during that period.
It’s crucial to remember that while candlestick patterns provide valuable insights into potential market movements, they cannot predict the future with certainty. Market conditions can be highly volatile, and trends may persist against expectations. Therefore, it’s prudent to avoid investing or trading funds that are essential or beyond your risk tolerance.
Integrating candlestick patterns and technical indicators into a comprehensive market analysis strategy, alongside fundamental analysis methods, enhances the accuracy of forecasts and mitigates trading risks. This holistic approach supports informed decision-making and fosters a deeper understanding of market dynamics.
